

Industry and device mix explain most of the spread you’ll see between your store and a “benchmark.” The number that actually matters for prioritising fixes isn’t conversion rate alone. It’s revenue per visitor, because a lower conversion rate paired with a higher average order value can beat a flashier percentage every time.
TL;DR:
- Conversion rate alone is misleading; revenue per visitor is a more accurate metric for assessing store performance and fixing issues.
- Industry verticals significantly impact benchmarks, with food, beverage, and skincare achieving around 2.4%, while high-consideration categories like furniture underperform.
- Mobile channels convert lower than desktops, and page load time directly affects conversion, with a drop from 3.05% at one second to 0.67% at four seconds load time.
- Regional benchmarks vary widely, with EMEA averaging 2.89%, Americas at 2.69%, and APAC at 1.58%, often due to payment and logistics differences.
- Prioritize fixing page speed, checkout friction, and top product pages to achieve quick conversion improvements, measuring results through revenue per visitor.
Table of Contents
- What are the current conversion rate benchmarks ecommerce stores should use?
- How do ecommerce conversion benchmarks vary by industry?
- What do device and channel benchmarks say about where you’re losing sales?
- How do conversion rates differ by region?
- What percentile should you actually aim for?
- How do you measure conversion rate correctly without comparing apples to oranges?
- Which fixes should you prioritise to move conversion rate now?
- Why does the headline average conversion rate move so much year to year?
- Our quick checklist for triaging a client’s conversion performance
- Turn these benchmarks into a revenue plan
- Sources
What are the current conversion rate benchmarks ecommerce stores should use?
Every panel publishes a different number, and none of them are wrong. They’re just measuring different populations.
A rolling panel weighted towards smaller Shopify stores will report a lower average than one built from enterprise-scale retailers with dedicated conversion rate optimisation teams.
Here’s a snapshot of where the headline figures land right now.
Differences in denominator definitions, panel composition, and category mix explain variations in reported conversion rates, as panels may count sessions or unique visitors, skew enterprise or small stores, or vary by industry verticals.
Pick the panel closest to your store’s size, platform, and traffic mix before deciding whether you’re behind. Comparing a mobile-heavy fashion store against an enterprise electronics panel will make you think you’re failing when you’re actually normal for your segment.
How do ecommerce conversion benchmarks vary by industry?
Industry is the single biggest lever behind any conversion rate benchmark, and the gap between verticals is wider than most store owners expect.
Food and beverage and skincare both converted at 2.4% in Statista’s Q1 2026 snapshot, the highest of the tracked categories. Home and furniture and luxury goods typically sit even lower than electronics in most panels, because these are higher-consideration purchases with longer research cycles.
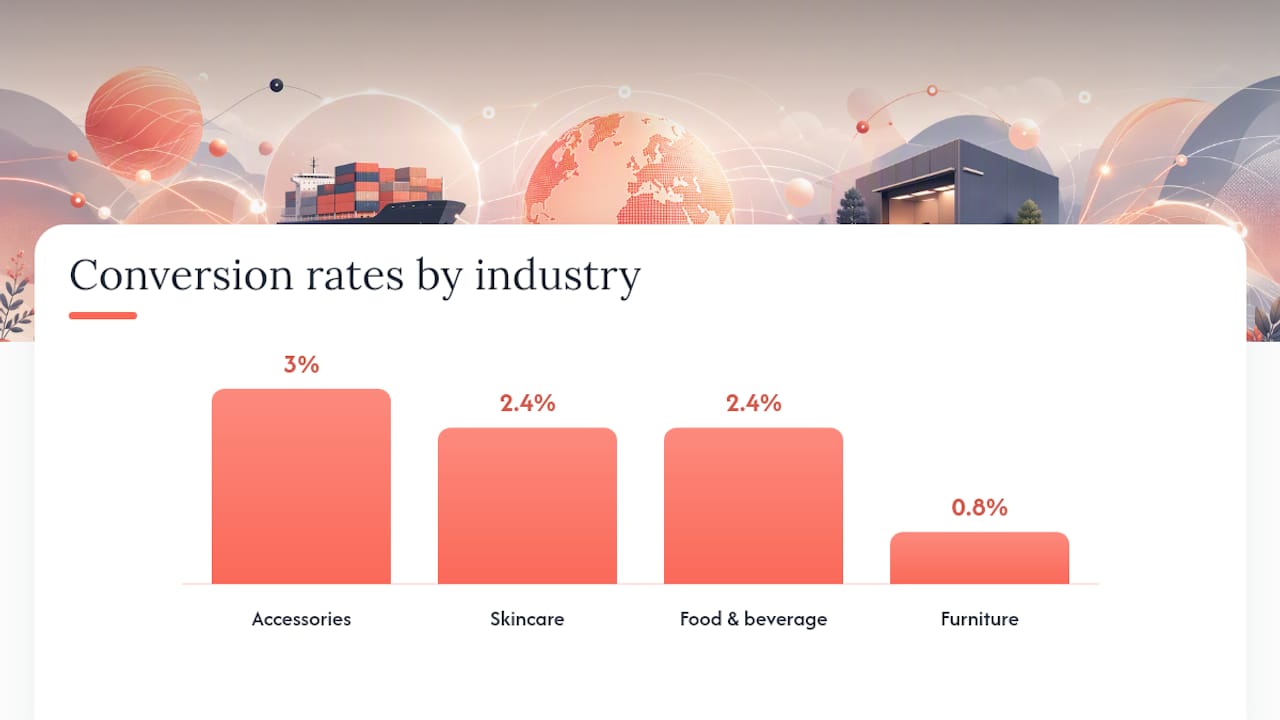
Conversion rate on its own can mislead you if you ignore average order value. A furniture store converting at 0.8% with a $1,800 AOV generates far more revenue per visitor than an accessories store converting at 3% with a $35 AOV. Multiply it out: 0.008 × $1,800 = $14.40 RPV versus 0.03 × $35 = $1.05 RPV. That’s the maths that should actually guide where you invest, not the raw conversion percentage.
Which percentile should you chase? It depends on your stage:
- New or early-stage stores should target the median (P50) for their vertical as a baseline. Beating the median means you’re doing something right structurally.
- Established stores with proven traffic should aim for the top 20% (P75). This is where solid product pages, decent page speed, and a clean checkout start compounding.
- Mature, well-optimised brands should push toward the top 10% (P90). Getting here usually means dedicated testing cadence, not one big redesign.
Don’t chase a benchmark from a different category. A skincare brand aiming for electronics-level conversion is aiming too low. An electronics retailer measuring itself against skincare is setting an unrealistic target.
What do device and channel benchmarks say about where you’re losing sales?
Mobile generally converts lower than desktop in 2026 panels, with desktop sessions tending to have higher purchase intent; many shoppers research on mobile and complete purchases on desktops.
Channel quality varies just as much as device:
- Email typically converts highest of any channel, because the audience already knows the brand and has opted in.
- Organic search converts well for high-intent, bottom-of-funnel queries but poorly for broad informational traffic.
- Paid search sits in the middle, conversion depends heavily on keyword intent matching and landing page relevance.
- Paid social generally converts lowest per session, since it interrupts rather than responds to intent, though it often wins on volume and lower cost per click.
Statistic to watch: page load time has one of the clearest, most measurable relationships to conversion of any technical factor. Published performance testing shows conversion at 1 second load time reaching 3.05%, dropping to just 0.67% at 4 seconds.
If your mobile conversion is trailing desktop by more than a couple of points, check page speed and checkout friction before assuming it’s a traffic quality problem. Those two levers are the ones you control directly, and they usually move faster than a full redesign.
How do conversion rates differ by region?
Regional benchmarks diverge more than most marketers assume, and the gap isn’t really about consumer behaviour, it’s about market structure.
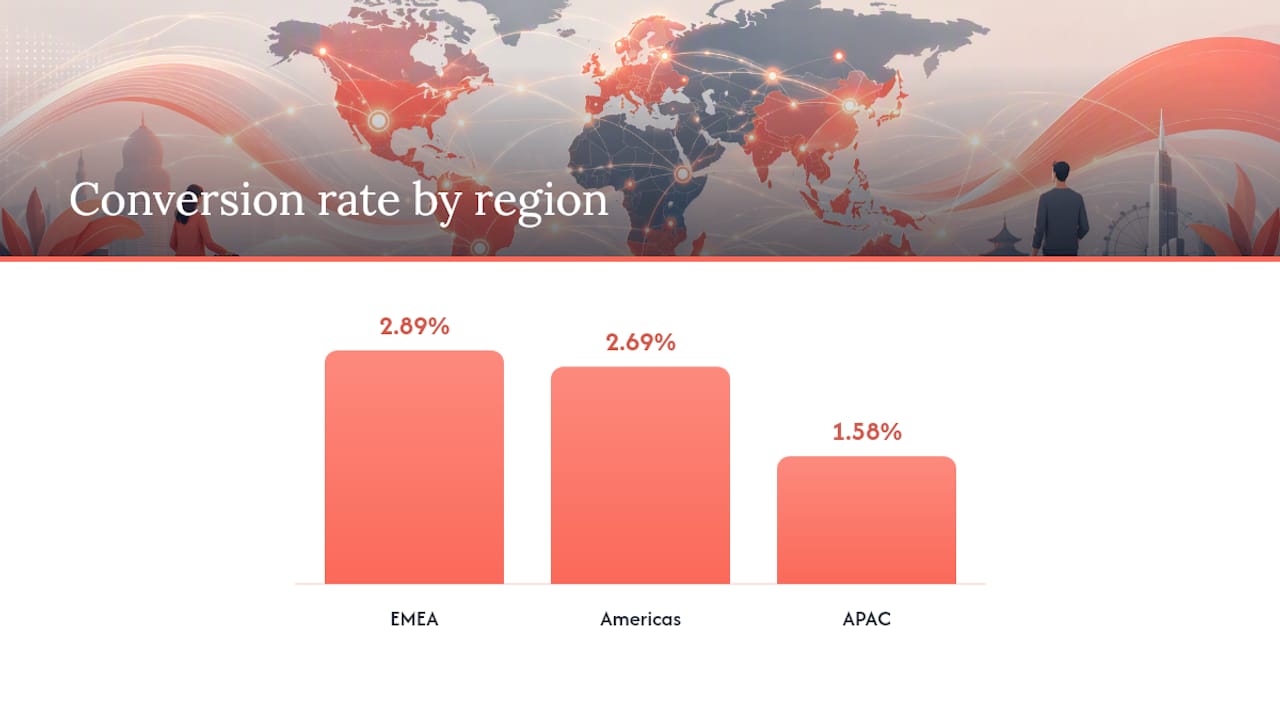
Large rolling panels put EMEA around 2.89%, the Americas around 2.69%, and APAC around 1.58% on a trailing twelve month basis, according to industry benchmark roundups tracking regional panels. That’s more than a point of difference between the top and bottom region.
A few structural reasons explain the APAC figure specifically:
- Payment method fragmentation across APAC markets means more checkout abandonment when a preferred local payment option isn’t offered.
- Logistics variability in some APAC markets creates hesitation at checkout when delivery timeframes feel uncertain.
- Panel composition matters too, many rolling panels have fewer APAC-based enterprise brands represented, which can drag the regional average down independent of actual consumer behaviour.
If most of your traffic comes from one region, benchmark against that region’s figure rather than the global blend. A store trading mostly with EMEA customers shouldn’t measure itself against an APAC-weighted global average, and vice versa. Retail seasonality also plays into this. Australian retailers can cross-check demand patterns against the ABS retail trade data when deciding whether a dip is regional softness or a genuine conversion problem.
What percentile should you actually aim for?
“Good” isn’t a fixed number. It’s a percentile relative to your category, and the right target shifts depending on where your business is right now.
Category and AOV change what “good” looks like in revenue terms, not just percentage terms. Picture two stores both sitting at the median conversion rate for their category. One sells $40 candles, the other sells $600 jackets. The candle store needs roughly 15 times the traffic to match the jacket store’s revenue per visitor at the same conversion rate. Chasing a higher conversion percentage matters less here than protecting AOV.
Target setting by stage looks like this:
- Pre-product-market-fit stores should focus on reaching the category median before anything else. If you’re well below median, something structural is broken.
- Stores with consistent traffic and repeat customers should push for P75, the top 20% bracket, where checkout friction and page speed fixes usually deliver the biggest jump.
- Brands with mature testing programs should treat P90 as the real ceiling, and shift focus from conversion rate alone to revenue per visitor as the primary optimisation metric.
How do you measure conversion rate correctly without comparing apples to oranges?
Conversion rate is transactions divided by sessions or visitors, multiplied by 100. The formula looks simple, but the denominator is where most comparison errors happen.
Some platforms measure against sessions, others against unique users, and the two numbers can differ by a meaningful margin on sites with high repeat-visit behaviour within a single day. Before you compare your store to any published benchmark, check which denominator that panel uses, and check which one your own analytics platform defaults to.
Revenue per visitor, or RPV, solves a lot of these comparison headaches because it’s calculated as conversion rate multiplied by average order value. For a deeper look at how RPV fits alongside other core numbers, Moormarketing’s guide to ecommerce performance metrics walks through how they connect.
Three caveats worth adjusting for before you trust any benchmark comparison:
- Panel skew. Check whether the source panel leans enterprise or small-store, and adjust your expectations accordingly.
- Seasonal windows. November and December regularly outperform annual averages, one rolling panel recorded 3.32% in November 2025 against lower figures earlier in the year, according to seasonal conversion tracking. Compare Q4 to Q4, not Q4 to an annual figure.
- Channel mix shifts. A month with heavier paid social spend will naturally show a lower blended conversion rate than a month dominated by email and organic traffic, even with identical site performance.
Which fixes should you prioritise to move conversion rate now?
Benchmarks tell you where you stand. They don’t tell you what to fix first. Here’s the priority order that tends to produce the fastest, most measurable wins.
- Fix page speed before anything else. The jump from a 3 second load time to 1 second can roughly triple conversion based on published performance testing, and it’s usually a technical fix rather than a design overhaul.
- Audit checkout friction next. Cart abandonment sits near 70% across most studies, and a meaningful chunk of that is recoverable through fewer form fields, visible shipping costs earlier, and more payment options.
- Rework your top five product pages. These pages carry disproportionate traffic. Improving imagery, social proof, and clear sizing or specification details here moves the needle faster than site-wide changes. A detailed guide on Shopify conversion rate optimisation covers this in platform-specific detail.
- Test offer framing on high-traffic entry pages, bundle pricing, free shipping thresholds, or limited-time framing, before touching broader site design.
- Build returning-customer reuse into your funnel. Email and SMS flows targeting past purchasers convert at a multiple of cold traffic and lift blended RPV without extra ad spend.
Pro Tip: Run one test at a time on high-traffic pages, and measure it against RPV, not just conversion rate. A test that lifts conversion but drops AOV can leave you worse off overall, and you’ll only catch that if RPV is your scoreboard. Details on faster wins can be found in a detailed piece on how to improve website conversion fast.
Why does the headline average conversion rate move so much year to year?
The “average” figure you see quoted shifts each year for reasons that have little to do with consumer behaviour changing overnight. Panel composition changes as sources add or drop participating stores, and definitional drift, sessions versus users, tracked versus untracked traffic, quietly moves the number too.
There’s also a real underlying trend: page speed and checkout design have both improved industry-wide over recent years, which nudges baseline conversion up structurally even without any single store doing anything different. At the same time, paid social’s growing share of traffic mix tends to drag blended averages down, because paid social traffic converts lower per session than email or organic.
The practical takeaway is to treat any single year’s headline figure as a snapshot, not a trend line, unless you’re comparing the same panel’s methodology year over year. Comparing this year’s Statista snapshot to last year’s Dynamic Yield panel will show you a “trend” that’s really just a panel switch. If you want to track your own trajectory accurately, benchmark against your own historical data first, and use external panels only to sanity check your relative position within your category.
Our quick checklist for triaging a client’s conversion performance
Before touching a single page, a thorough check considers five things: data sanity (is tracking firing correctly), device split, top product page performance, checkout drop-off points, and channel-level ROAS.
Fixes to broken tracking or checkout bugs often show results within a week. Structural tests, page redesigns, offer restructuring, take four to eight weeks to read cleanly. Run your own AOV and session numbers through the RPV formula above before assuming a benchmark gap is a real problem rather than a category difference.
— Liza
Turn these benchmarks into a revenue plan
Reading a benchmark table tells you where you sit. It doesn’t fix a slow checkout or a mobile page that’s bleeding conversions before someone even sees your product. A direct approach with senior strategists, without outsourced execution, turns this kind of data into a prioritised action plan for stores. Similar methods have helped toy retailers and furniture brands achieve substantial monthly sales.

If you want a straight read on where your store sits against its category and what to fix first, a working audit is the fastest way to get one. Our ecommerce marketing workshops walk through your own numbers live, or if you’re ready for hands-on support across paid media, site conversion, and retention, our 12 week double your revenue challenge is built to compress that timeline. Start with a look at working with us to see which option fits where you’re at.
Sources
- Global conversion rate by industry and device (Statista)
- Retail trade, Australia (Australian Bureau of Statistics)