

Customer lifetime value is the total profit a customer generates across their relationship with your store, and growing it comes down to one priority: retention first. Retention compounds every other number in the business, expansion (average order value and subscriptions) is the second lever, and margin or product fit is the third. Fix retention before you pour more money into acquisition — the maths behind LTV growth in ecommerce rewards that order every time.
TL;DR:
- Focusing on retention first can multiply the impact of increasing average order value and margins, often yielding up to 95% profit growth from small retention improvements.
- Cohort-based LTV tracking and measuring different time windows prevent noisy data and ensure accurate assessment of long-term strategies.
- Prioritizing retention, expansion, and margin improvements together produces the strongest revenue growth, especially when retention significantly extends customer lifespan.
- Improving product mix and avoiding aggressive discounting helps sustain higher LTV by supporting higher margins and targeted upselling opportunities.
- Using first-party data and early behaviour-based predictive models enables faster, more reliable LTV forecasting and smarter budget allocation.
Table of Contents
- What is LTV growth in ecommerce and how do you calculate it?
- Why retention beats acquisition every time
- AOV tactics: bundles, upsells, thresholds and checkout tweaks
- Retention tactics that compound: email, SMS, loyalty and win-back
- When subscription and replenishment models pay off
- Building cohort dashboards and reading LTV:CAC properly
- Your 30/90/180-day plan to lift LTV
- How Moormarketing applies this in practice
- How product mix and pricing strategy shape LTV
- Predictive analytics and machine learning for LTV forecasting
- Why customer experience and support drive LTV
- Real-world examples of LTV growth in action
- Where to focus given rising CAC and privacy shifts
- Get hands-on help lifting LTV without the agency runaround
- Benchmarks and playbooks worth reading next
- Sources
- FAQ
What is LTV growth in ecommerce and how do you calculate it?
Customer lifetime value, or LTV, is the total revenue (or profit, in the better version of the formula) a customer generates before they stop buying from you. The simplest version is:
LTV = Average Order Value × Purchase Frequency × Customer Lifespan
That gets you a number fast, but it hides more than it reveals. A profit-weighted version strips out cost of goods, shipping, and payment fees so you’re looking at contribution margin per customer, not top-line revenue. That’s the number that actually tells you what you can afford to spend acquiring someone.
The better method is cohort-based LTV. Instead of averaging every customer who ever bought from you, group customers by acquisition month, channel, or first SKU purchased, then track how each group’s spending evolves over time. Cohort analysis exposes differences that a blended average conceals entirely — a Facebook-acquired cohort might return half as often as an organic-search cohort, and you’d never spot it from a single average LTV figure.
Pick your measurement window based on the decision you’re making:
- 30 to 90 days for early signal on new campaigns or products
- 12 months for acquisition budgeting and CAC payback calculations
- 3 years for board-level benchmarking and long-term brand valuation
Mixing these windows is a common mistake. A 12-month figure justifies today’s ad spend; a 3-year figure tells the strategic story to investors or partners. Blending the two produces noisy, inconsistent decisions.
Why retention beats acquisition every time
Three levers move LTV: retention, expansion, and margin. Retention wins the priority race because it multiplies the other two, not because it’s the only lever that matters.
Here’s the logic. If a customer buys once and never returns, your AOV and margin only apply to that single transaction. Extend their relationship to five purchases and every improvement you make to order value or product margin gets multiplied by five. Retention isn’t just another tactic sitting alongside AOV and margin — it’s the multiplier that determines how much those other two levers are worth.
The retention multiplier: Bain research often cited by growth practitioners suggests a 5% increase in retention can lift profits by 25% to 95%, depending on the industry. That range is wide because retention’s impact compounds differently across margin structures, but the direction is consistent everywhere.
Expansion is the second lever. This covers average order value, cross-sell, upsell, and subscription attachment. Practitioners who pull retention, expansion, and margin together, rather than optimising just one in isolation, tend to see the strongest combined returns — a bundle that lifts AOV also often nudges repeat rate, because customers who feel they got value the first time come back sooner.
Margin and product fit round out the trio. A customer who buys high-margin products and rarely returns items costs you far less to serve than one who buys thin-margin items and returns a third of them. Improving fit (better sizing guides, clearer product photography, honest reviews) reduces returns and frees up budget that would otherwise go to reverse logistics.
Practical breakdown of where to focus first:
- Retention (priority one): lifecycle email/SMS, loyalty, replenishment reminders, win-back flows
- Expansion (priority two): bundles, upsells, free-shipping thresholds, subscription offers
- Margin/fit (priority three): sizing and fit tools, return-rate reduction, product mix review
AOV tactics: bundles, upsells, thresholds and checkout tweaks
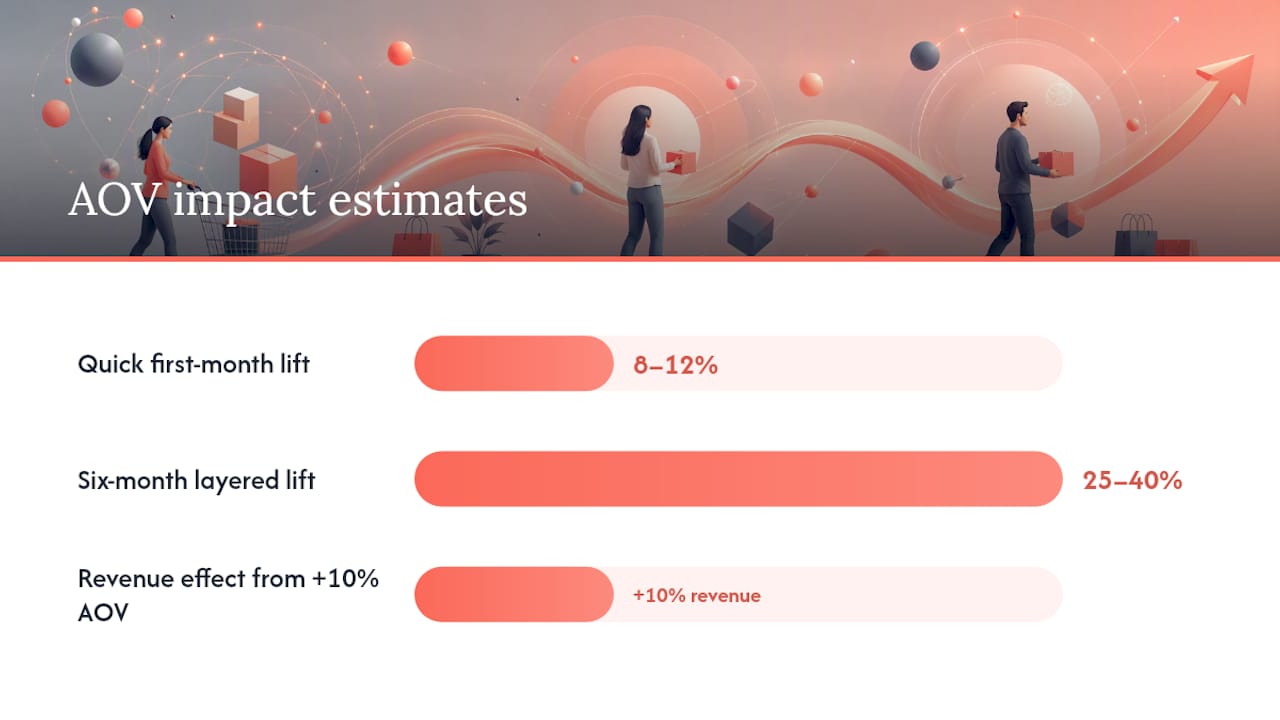
Layered AOV tactics — bundling, upselling, threshold incentives, and pricing psychology working together — can lift average order value by 25% to 40% within six months, with quick wins landing an 8% to 12% bump in the first month alone. Here’s the order to run them in.
- Build product bundles and “frequently bought together” prompts. Group complementary items at a small discount versus buying separately. This is the fastest AOV win because it requires no new inventory, just merchandising logic.
- Add a cart progress bar tied to your free-shipping threshold. Set the threshold roughly 20% to 30% above your current AOV — high enough to inspire a top-up purchase, not so high that shoppers abandon the cart in frustration.
- Deploy last-chance upsells at checkout. A single relevant add-on offered at the point of payment, not before, converts better than the same offer shown earlier in the funnel.
- Layer in post-purchase offers on the confirmation page. Customers who just completed a purchase are in a buying mindset; a time-limited discount on a complementary item captures that momentum. Structured post-purchase email sequences extend this window well past the confirmation page itself.
- Enable BNPL and saved-card checkout options. Buy-now-pay-later unlocks higher-ticket purchases that shoppers would otherwise abandon at the price point, and saved cards remove friction from the second and third purchase.
A 10% increase in AOV at the same traffic and conversion rate delivers 10% more revenue outright, and because fulfilment costs are largely fixed per order, the profit impact usually outpaces the revenue impact.
Pro Tip: Test your free-shipping threshold change on its own for two weeks before adding bundles on top of it. Stacking multiple AOV changes at once makes it impossible to know which one actually moved the needle.
Retention tactics that compound: email, SMS, loyalty and win-back
Email and SMS remain the highest-leverage owned channels for driving repeat purchases, mostly because they’re the only channels where you own the relationship outright and aren’t paying a platform for every impression.
Five flows do most of the heavy lifting:
- Welcome series for new subscribers or first-time buyers, setting expectations and delivering an early incentive to purchase again.
- Post-purchase sequence that confirms the order, offers care or usage tips, then transitions into a review request and cross-sell.
- Replenishment reminders timed to when a consumable product is likely running low, based on the average reorder cycle for that SKU.
- Browse abandonment for shoppers who viewed products but didn’t add to cart, distinct from cart abandonment flows.
- Win-back sequences triggered when a previously active customer crosses a defined inactivity window, often 60 or 90 days depending on your typical purchase cycle.
Building out these sequences properly, rather than relying on generic templates, is covered in more detail in a full breakdown of ecommerce email flows.
Don’t just assume these flows are working because open rates look healthy. Run holdout tests: withhold a campaign or flow from a randomly selected control group and compare their LTV against the treated group over the same window. This is the only reliable way to measure true incremental lift rather than crediting a sale to email that would have happened anyway.
Loyalty programmes lift repeat purchase rate, but only when the reward structure doesn’t quietly erode margin. Point systems that award a percentage of spend back as store credit work well because the discount is deferred and often forfeited; flat percentage-off codes issued too often just train customers to wait for the next one. Detailed frameworks for retention-focused loyalty design go deeper on structuring rewards without cannibalising margin.
When subscription and replenishment models pay off
Subscription and replenishment mechanics work best for consumables. Coffee, supplements, pet food, skincare, and razors all have a natural reorder cycle, which makes a subscription an easy, low-friction sell. Durable goods like furniture or electronics don’t have that natural cadence, so forcing a subscription model onto them usually backfires and annoys customers more than it retains them.
Subscription models can push LTV to 2 to 3 times the transactional equivalent in comparable verticals, largely because the friction of a repeat purchase decision disappears entirely.
If you’re piloting a subscription offer, keep the test tight:
- Onboard new subscribers with a short explainer of how to skip, pause, or change cadence, since flexibility is what keeps churn low.
- Offer two or three cadence options (say, every 30, 45, and 60 days) rather than a single fixed schedule.
- Test a modest discount against a value-add (free gift, exclusive product) to see which converts better without eating into margin the same way a discount does.
Watch three numbers closely during the pilot: early repurchase rate in the first 30 days, churn at the 30, 90, and 365-day marks, and LTV specifically for the subscription cohort versus your one-off buyer cohort. If subscription LTV isn’t meaningfully ahead of transactional LTV by the 90-day mark, the mechanics need adjusting before you scale the offer store-wide.
Building cohort dashboards and reading LTV:CAC properly
A cohort dashboard needs three fields at minimum: acquisition date, acquisition channel, and first SKU purchased. From there, track repeat purchase rate, average order value, and cumulative revenue per cohort at 30, 90, 365-day, and 3-year intervals.
The metric everyone quotes is LTV:CAC, and the “3:1 rule” gets repeated as if it’s universal. It isn’t. Vertical benchmarks show the cross-industry median LTV:CAC sits around 3.4:1, with the top quartile closer to 5.6:1. Subscription, pet, and supplement brands often run well above that median; apparel and electronics tend to sit below it because of thinner margins and lower repeat rates. Treat 3:1 as a floor, not a target, and benchmark against your own vertical rather than a flat industry number.
CAC payback months matter just as much as the ratio itself. A brand with a 4:1 LTV:CAC but a 14-month payback period has a cash-flow problem even though the ratio looks healthy on paper. Faster payback means you can reinvest sooner and scale acquisition with less risk.
Practical measurement checklist:
- Track cohort LTV monthly, but don’t react to a single month’s wobble; look for a trend across at least three cohorts before calling it a signal.
- Recalculate LTV:CAC quarterly using the 12-month LTV window, not the 3-year figure, for budgeting decisions.
- Flag any cohort whose 90-day repurchase rate drops more than 15% below the trailing average; that’s usually the earliest warning sign of a retention problem before it shows up in revenue.
Your 30/90/180-day plan to lift LTV
You don’t need a data team to start moving LTV this quarter. Sequence the work like this.
- Days 1 to 30: Adjust your free-shipping threshold, launch three product bundles based on your best-selling SKU pairings, and stand up a basic post-purchase email flow if you don’t already have one.
- Days 31 to 90: A/B test upsell placement (checkout versus post-purchase page), pilot an SMS replenishment sequence for your top consumable product, and get cohort LTV tracking running in a spreadsheet or analytics tool, even if it’s manual at first.
- Days 91 to 180: Launch a subscription option for your best-fit consumable products, rebuild your acquisition budget using 12-month cohort LTV instead of last-touch attribution, and automate expansion triggers (like a win-back offer that fires automatically at day 60 of inactivity).
Pro Tip: Run one change per flow at a time in the first 30 days. It’s tempting to overhaul everything at once, but you’ll have no idea which change actually drove the lift you see in week six.
How Moormarketing applies this in practice
Retention-first LTV growth sounds simple on paper and gets messy in execution, which is exactly where most ecommerce teams stall. Moormarketing works directly with brand owners to build the cohort tracking, lifecycle flows, and AOV tests described above, without outsourcing the strategy or execution to junior contractors.
That hands-on approach has produced tangible outcomes for clients, including toy retailers and global furniture brands achieving significant monthly sales. Some clients have experienced revenue growth substantial enough to change their personal work situations. These results came from senior strategists running data-driven audits and building retention and AOV programs specific to each brand’s product mix, not generic templates applied across every account. The same prioritisation logic covered in the three-lever growth framework underpins how those engagements are structured from day one.
How product mix and pricing strategy shape LTV
The products you sell and how you price them set a ceiling on how far retention and AOV tactics can push LTV. A store built around a single low-margin hero product has less room to manoeuvre than one with a range spanning entry-level and premium tiers, because there’s nowhere to trade a customer up to.
Product mix affects LTV in two distinct ways. First, a wider assortment gives you more cross-sell and bundle opportunities, which directly supports the AOV lever. Second, mix affects repeat purchase timing: a store selling only durable goods (say, furniture) has a naturally longer repurchase cycle than one selling consumables, which caps how often retention tactics can even trigger a sale.
Pricing strategy interacts with this in a way many brands get backwards. Discounting aggressively to win a first sale often lowers LTV over time, because it trains that customer to wait for the next discount rather than buy at full price. A tiered pricing structure, where entry products introduce customers to the brand and higher-tier products capture value once trust is established, tends to protect margin while still supporting the volume that retention marketing needs to work with.
Reviewing product mix isn’t a one-off exercise. Retiring low-margin SKUs that don’t support repeat purchase, and doubling down on the products that do, is one of the highest-leverage, lowest-cost moves available to a store that’s already invested in retention and AOV work but has hit a plateau.
Predictive analytics and machine learning for LTV forecasting
Predictive LTV models use historical purchase data, typically the first 30 to 90 days of a customer’s behaviour, to forecast their likely lifetime value well before the traditional 12-month cohort window closes. This matters because waiting a full year to know whether a channel or campaign is working is far too slow for a business making weekly ad-spend decisions.
The most common predictive approach uses probabilistic models (like BG/NBD or Pareto/NBD, both standard in ecommerce analytics tooling) to estimate future purchase frequency based on early behavioural signals: how quickly a customer made their second purchase, what they bought first, and which channel brought them in. Machine learning models built on top of this add more variables, like browsing behaviour, discount sensitivity, and product category affinity, to refine the forecast further.
The practical value isn’t the sophistication of the model, it’s speed. A predictive model that flags a low-LTV cohort within the first 30 days lets you cut spend on that channel or campaign months before a traditional 12-month LTV calculation would have told you the same thing. For most mid-sized ecommerce stores, a simpler probabilistic model applied consistently beats a complex machine learning system nobody on the team fully understands or trusts. Start with disciplined cohort tracking before reaching for predictive tooling. The forecasting only adds value once the underlying cohort data feeding it is clean.
Why customer experience and support drive LTV
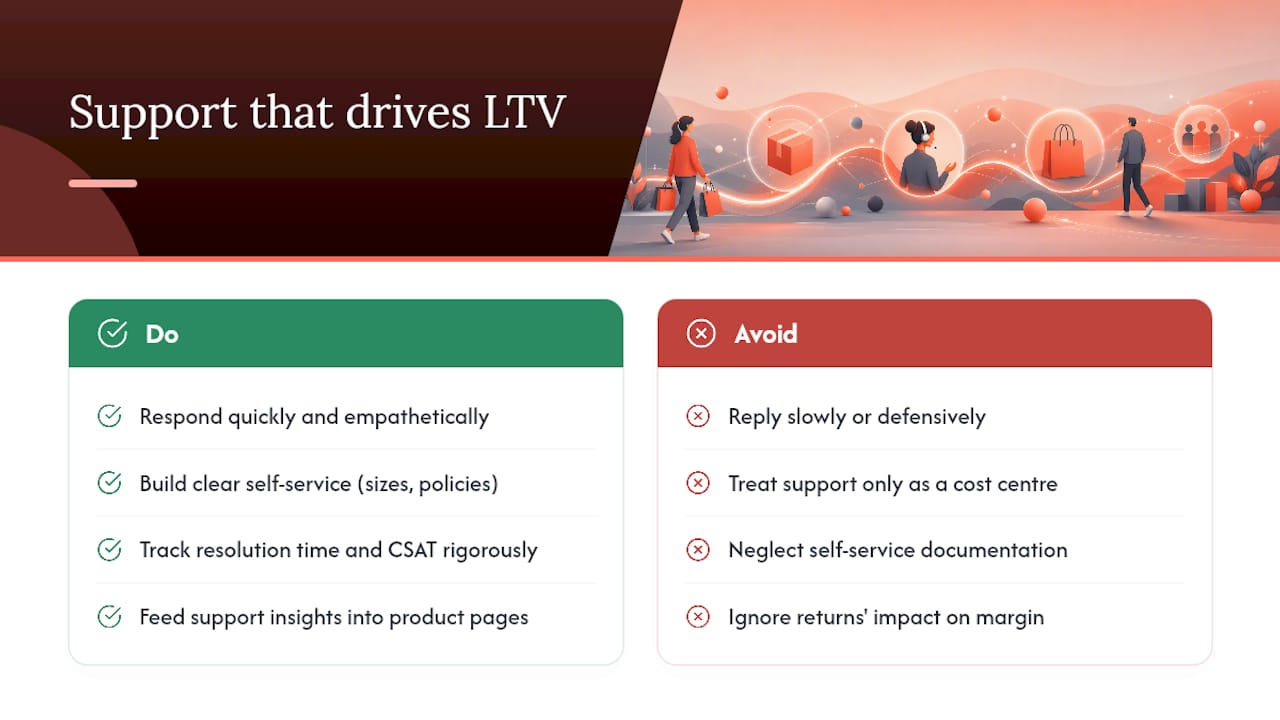
Support interactions are retention moments in disguise. A customer who has a problem resolved quickly and well is often more likely to buy again than one who never had an issue at all, because the resolution proves the brand stands behind its product.
Response time matters more than most brands assume. A slow or defensive support response after a bad experience compounds the original problem and pushes a customer straight into the win-back segment (or worse, into leaving a public negative review that costs you future customers too). Fast, empathetic resolution does the opposite: it can turn a one-star moment into a five-star relationship.
Self-service experience matters just as much as human support. Clear sizing guides, honest product descriptions, and easy-to-find shipping and return policies reduce the number of support tickets in the first place, which means the support team has more capacity to handle the interactions that genuinely need a human touch. This is also where returns and product fit tie back into the margin lever: better pre-purchase information reduces returns, which protects margin, which in turn funds more retention marketing.
The brands with the strongest LTV numbers tend to treat support as a growth function, not just a cost centre. That means tracking resolution time and customer satisfaction with the same rigour as email open rates or AOV, and feeding support insights back into product pages, sizing tools, and FAQ content to prevent the same issue from generating a support ticket twice.
Real-world examples of LTV growth in action
The clearest illustration of retention-first LTV growth comes from Moormarketing’s own client work. A global furniture brand generating $3 million a month didn’t get there through acquisition spend alone; durable goods have long purchase cycles, so the growth strategy leaned heavily on expansion (higher-value product attachment, financing options at checkout) and margin discipline, since a single furniture customer might only buy once every few years.
A toy retailer reaching $2 million in monthly sales sits at the opposite end of the purchase-frequency spectrum. Toys and children’s products have shorter natural repurchase cycles (birthdays, holidays, growing children needing new sizes), which makes lifecycle email and SMS retention flows disproportionately valuable compared to a durable-goods brand. The tactics that moved the needle were less about a single dramatic change and more about consistent execution of the fundamentals covered earlier: cohort tracking to see which acquisition channels actually retained customers, bundling to lift AOV, and win-back flows timed to that vertical’s natural repurchase window.
Neither result came from a single tactic. They came from applying the three-lever framework in the right order for that specific product category, then measuring cohort by cohort to confirm what was actually moving the number, rather than assuming a tactic that worked for one brand would automatically work for another.
Where to focus given rising CAC and privacy shifts
Acquisition costs keep climbing and privacy changes keep degrading attribution accuracy, which makes retention and AOV the more reliable levers to pull before expanding acquisition budgets further. Keep your cohort windows and CAC payback months visible on a dashboard someone actually checks weekly, not buried in a report nobody opens.
Test fast, but measure with holdout groups rather than trusting channel-reported attribution, which grows less reliable every year. First-party data (email, SMS, direct purchase history) is the asset that survives every platform and privacy change ahead. Everything built on it compounds; everything borrowed from a platform’s black-box attribution doesn’t.
— Liza
Get hands-on help lifting LTV without the agency runaround
Reading the playbook is one thing. Running cohort dashboards, building lifecycle flows, and testing AOV changes on top of a full-time ecommerce operation is another. Moormarketing exists for exactly that gap: senior strategists working directly on your account, with no outsourcing to junior contractors and no generic template applied across every client.
If you’re looking for a structured, hands-on partner, the 12 Week DOUBLE Your Revenue Challenge is built for brands that want to move fast on retention, AOV, and margin work simultaneously rather than one lever at a time. For ongoing execution across email, SMS, CRO, and lifecycle campaigns, the Convert More Customers service page covers the day-to-day programs that keep LTV climbing after the initial push. Brands considering a subscription launch or a full product mix review get the most from a direct strategy conversation first. Book a look at your current numbers through Moormarketing’s services and find out which lever is costing you the most revenue right now.
Benchmarks and playbooks worth reading next
- Vertical LTV:CAC benchmarks for 2026, for setting realistic targets by industry
- AOV optimisation tactics and testing frameworks, for structured AOV experiments
- Retention strategy fundamentals, for lifecycle and loyalty programme design
Sources
- How to increase customer lifetime value | Perspective AI
- AOV optimization: proven tactics to raise average order value
- Average order value (Shopify blog)
FAQ
What is LTV in ecommerce?
LTV, or customer lifetime value, is the total revenue or profit a customer generates over their entire relationship with your store. It’s typically calculated as average order value multiplied by purchase frequency multiplied by customer lifespan, though cohort-based tracking gives a more accurate picture than a single blended average.
What is the 80/20 rule in ecommerce?
The 80/20 rule, also called the Pareto principle, suggests roughly 80% of a store’s revenue often comes from around 20% of its customers. In practice this means identifying and retaining your highest-value repeat customers matters more than treating every customer segment identically.
What does LTV mean in digital marketing?
In digital marketing, LTV is used to set acquisition budgets and evaluate channel performance, since a channel that brings in customers with higher long-term value can justify a higher cost per acquisition. Comparing LTV against customer acquisition cost, expressed as the LTV:CAC ratio, is the standard way marketers decide how much to spend per channel.
What is LTV in B2B?
LTV in a B2B context usually reflects contract value, renewal rate, and account expansion over the life of a client relationship, rather than individual transaction size. The underlying principle is the same as ecommerce: retention and expansion multiply the value of each acquired account over time.
How does Moormarketing help increase LTV?
Moormarketing builds retention, AOV, and margin programs specific to a brand’s product mix, using senior strategists rather than outsourced execution. Current service details and pricing are available directly on the Moormarketing site.