

Start with your real user data. Open Shopify’s Web Performance reports, find your biggest gap against the Core Web Vitals targets, then attack the three fixes that move the needle fastest: the hero image causing a slow LCP, the app scripts blocking render, and the Liquid loops adding milliseconds to every request. Good LCP sits at 2.5 seconds or under, INP under 200 milliseconds, CLS at 0.1 or less. Everything below explains how to find your actual numbers and fix them in the right order.
TL;DR:
- Most speed issues stem from either slow TTFB caused by server or Liquid rendering problems, or LCP delays from large or lazy-loaded hero images.
- Using real user data is essential to accurately diagnose which metric is failing before applying any fix, as lab tests may not reflect actual customer experiences.
- Prioritize fixing the hero image load time and removing unnecessary third-party scripts, with steps that can often be done without developer aid.
- Liquid code optimizations and deferred JavaScript should follow, but only after addressing the fastest-impact fixes, since these require theme editing.
- Regular performance monitoring with Shopify reports and Chrome tools is crucial to prevent regressions and verify that fixes impact core Web Vital metrics.
Table of Contents
- Why Shopify site speed matters for conversions
- How do you measure Shopify speed accurately?
- Common Shopify bottlenecks and how to spot them
- High-impact fixes for LCP and INP
- How do you prioritise the fixes?
- Tools for verifying and monitoring Shopify performance
- What Moor Marketing sees inside underperforming Shopify stores
- The diagnostics‑first approach most stores skip
- Get a Shopify speed diagnostic from Moor Marketing
- Sources
- FAQ
Why Shopify site speed matters for conversions
Speed is not a vanity metric. Shopify’s own analysis of storefront performance found that faster stores convert better, and even a half second of improvement can lift conversion rates, with LCP and INP correlating most strongly with sales. If your product pages load a beat slower than a competitor’s, you’re losing buyers before they see the “Add to Cart” button.
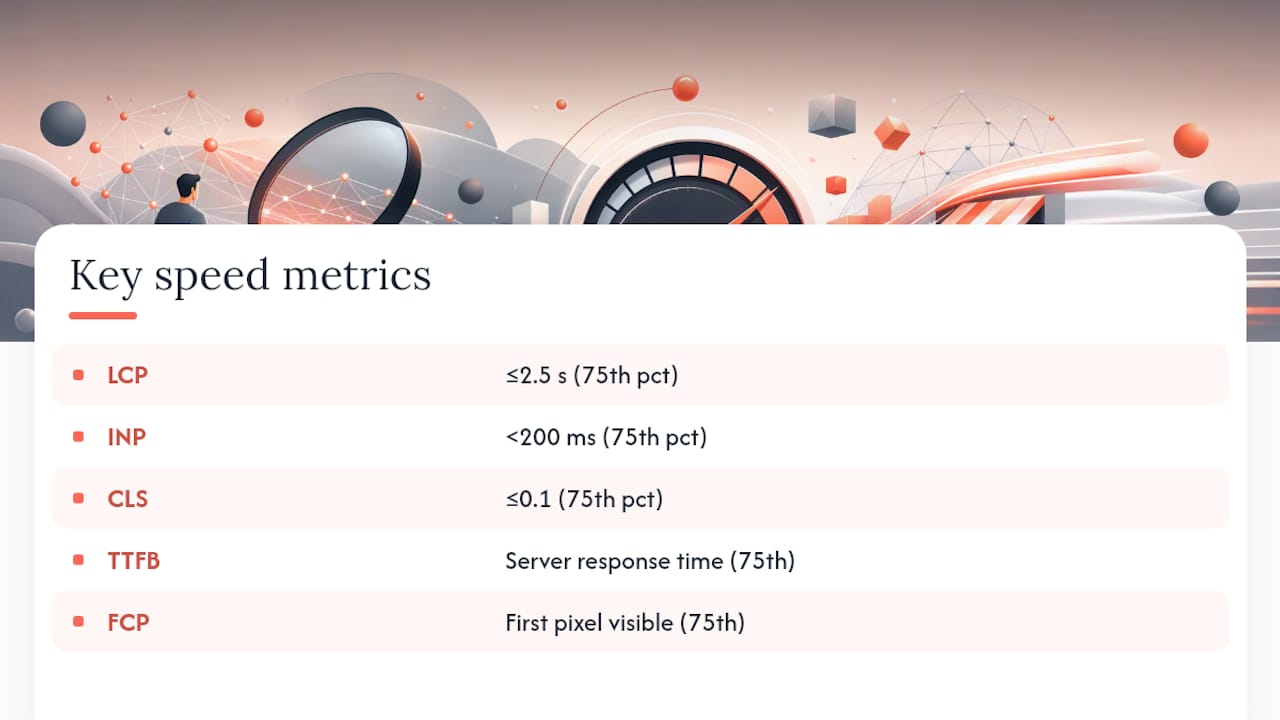
The numbers to know: a good Largest Contentful Paint (LCP) sits at 2.5 seconds or under, Interaction to Next Paint (INP) under 200 milliseconds, and Cumulative Layout Shift (CLS) at 0.1 or less, measured at the 75th percentile of real visits.
Five metrics matter here. LCP measures how long it takes the biggest visible element (usually your hero image or product photo) to render. INP measures how responsive your page feels when someone taps a button or filter. CLS tracks how much your layout jumps around as it loads. TTFB (Time to First Byte) tells you how fast your server responds before anything even starts rendering. FCP (First Contentful Paint) marks when the first pixel actually appears on-screen.
Shopify measures these at the 75th percentile, by page type and device, which matters because your product pages, collection pages, and homepage will each have different bottlenecks. Chasing a single average score across your whole store hides the pages actually losing you sales.
How do you measure Shopify speed accurately?
Guessing which fix to apply first wastes developer hours. Shopify’s own guidance is to diagnose using real user monitoring (RUM) data before touching any lab tool, because RUM reflects what actual customers on actual devices and connections experience, not a single test run in a clean browser.
Here’s the sequence that works:
- Open Shopify’s Web Performance report in your admin and select the page type, device (mobile matters more than desktop for most stores), and the 75th percentile view.
- Calculate the gap between your current score and the target for each metric: LCP, INP, CLS, and TTFB.
- If field data is thin (low traffic pages, a new theme), run WebPageTest or Lighthouse manually, matching the device and connection speed to your real customer base as closely as you can.
- Run at least three repeat tests in the lab tool and use the median, not the first run, since cold caches skew a single test.
- Match the gap to a diagnostic pattern before writing a single line of code.
That last step is where most people rush and get it wrong. A large TTFB gap almost always points to server or Liquid rendering issues. Fast TTFB paired with slow FCP usually means render-blocking CSS or JavaScript is holding up the first paint. Fast TTFB and fast FCP but slow LCP is the classic sign of a lazy-loaded hero image or a resource the browser has to discover late, rather than prioritise early.
Treat any lab result as a hypothesis, not a fix list. Shopify’s own guidance is blunt on this: reproduce the field gap in the lab before changing production code, because a lab test on a fast connection can hide a problem that’s crushing your mobile customers on 4G.
Common Shopify bottlenecks and how to spot them
Once you know which metric is failing, the cause usually falls into one of four buckets. Recognising the signature of each saves hours of guesswork.
- Liquid rendering and TTFB: a theme with deeply nested sections, repeated metafield lookups, or nested loops adds up. Shopify’s Theme Inspector for Chrome shows exactly which Liquid blocks are slow, line by line.
- Images and LCP: the two most common culprits are a hero image that’s lazy-loaded (delaying its own paint) and a background image set via CSS instead of an
<img>tag, which the browser discovers late. - Apps and third-party scripts: uninstalled apps that left snippets behind, or active apps injecting scripts on every page even when only one page needs them, are a frequent and completely avoidable drag.
- CSS, fonts, and layout shift: custom web fonts that swap in after the page loads, or images without explicit width and height, both cause visible jumps that tank your CLS score.
- One shared script, multiple regressions: a single review widget or chat script loaded in your theme’s
<head>can simultaneously delay TTFB (extra server calls), block FCP (render-blocking JavaScript), and shift layout (injecting content after load). Fixing that one script often improves three metrics at once.
The practical shortcut: open your theme’s installed apps list and cross-reference it against what’s actually visible on the page you’re testing. It’s common to find three or four scripts loading on every page load when only one page type needs them.
High-impact fixes for LCP and INP
Fix in this order. Image and script issues are usually the fastest wins; Liquid changes take longer but compound across your whole catalogue.
- Fix your LCP image first. Export it at the correct display size (not the original camera resolution), convert to WebP where your theme supports it, and use Shopify’s
image_tagwithsrcsetandsizesattributes so the browser loads the right file for the device. Critically, never lazy-load the image that’s your LCP element and mark it withfetchpriority="high"so the browser prioritises it from the first paint. - Audit every installed app. List every script firing on your storefront (Theme Inspector and your browser’s network tab both show this). Removing unused apps, rather than just disabling them, often returns immediate speed gains without touching a single line of theme code. For apps you keep, ask the vendor whether the script can defer loading until after the main content renders, and consolidate tracking pixels into a single tag manager where possible.
- Apply Liquid micro-optimisations. Move calculations that don’t change per-iteration outside of loops, assign
block.settingsto a variable once instead of calling it repeatedly, and cut down on nested renders and repeated metafield lookups. On a theme with many sections, these small changes can save 25 to 50 milliseconds of TTFB when combined, which sounds small until you multiply it across every page view. - Defer non-critical JavaScript and trim your CSS. Load anything that isn’t needed for the first screen after the main content, and reduce the number of separate stylesheets your theme pulls in. Inline critical CSS sparingly, only for the styles needed above the fold.
- Rethink your fonts. Custom web fonts that load late cause both slow FCP and layout shift. Preloading the exact font file you use, or switching to a system font stack for body text, removes both problems at once.
Pro Tip: Before you touch any Liquid code, install the Theme Inspector for Chrome and record your render times for the slowest template. Re-run it after each change so you can see which specific edit actually moved the number, instead of guessing.
Steps one and two are achievable by most store owners without a developer. Steps three and four usually need someone comfortable editing theme code, since a misplaced Liquid tag can break a template.
How do you prioritise the fixes?
Not every fix deserves the same urgency. Weigh impact against effort before you commit developer time.
- High impact, low effort: fixing the LCP image, removing dead apps, deferring non-critical scripts. Do these in the first week.
- High impact, higher effort: Liquid micro-optimisations across a complex theme, restructuring how apps inject scripts. Budget two to six weeks depending on theme complexity.
- Lower impact but still worth doing: minor CSS trimming, font preloading tweaks, once the bigger items are fixed.
A useful reminder here: Shopify already handles a chunk of this for you. The platform provides CDN delivery, automatic image optimisation, gzip and Brotli compression, and file minification by default, so your effort should go into theme code, installed apps, and third-party scripts, the things Shopify can’t optimise on your behalf.
A simple audit template keeps this organised, whether you’re doing it yourself or handing it to a developer: page and device tested, the percentile used, the gap against target for each metric, the suspected cause, the recommended fix, who owns it, the expected impact, and the test you’ll use to verify it worked. Quick wins land in the one to seven day column; anything touching theme architecture goes in the two to six week column.
Tools for verifying and monitoring Shopify performance
Fixing speed once and never checking again is how regressions creep back in.
- Shopify Web Performance reports give you the ongoing RUM baseline, by page type and percentile, and should be your first stop whenever something feels slower.
- Theme Inspector for Chrome pinpoints exactly which Liquid blocks are eating render time, before and after a change.
- WebPageTest shows a full waterfall of every request, useful for spotting exactly which script is blocking render.
- Lighthouse gives a quick lab snapshot of Core Web Vitals for a single page load.
- PageSpeed Insights is the fastest sanity check when you just need a number before a meeting.
- Lighthouse CI or Shopify’s own CI checks catch regressions automatically before a theme change goes live, rather than after a customer complains.
What Moor Marketing sees inside underperforming Shopify stores
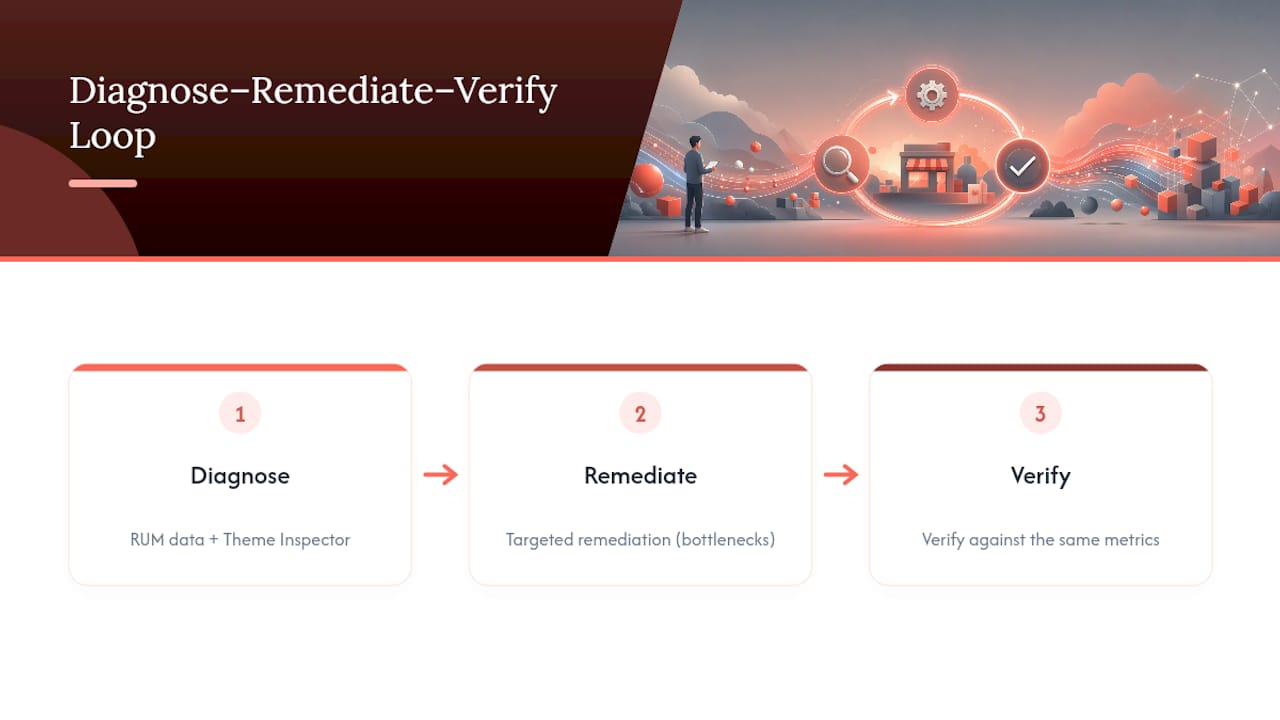
Moor Marketing works with growing eCommerce brands where speed problems have quietly been costing sales for months before anyone noticed. The pattern is consistent: a diagnostic pass using RUM data and Theme Inspector, followed by targeted remediation, then verification against the same metrics that flagged the problem originally. That diagnose, remediate, verify loop matters because it stops teams from “fixing” the wrong thing.
Some issues are genuinely a DIY job. Others, complex Liquid architecture on a large catalogue, a persistent third-party script nobody can safely remove, or a theme that’s been patched by three different developers over two years, benefit from a second set of experienced eyes before more time gets sunk into guesswork.
The diagnostics‑first approach most stores skip
Most Shopify speed advice jumps straight to a checklist: compress images, install a speed app, delete a few scripts. It’s not wrong, but it skips the step that actually tells you whether any of it will help. If your real bottleneck is a Liquid loop hammering TTFB, no amount of image compression touches that problem.
What the data actually supports is starting with the gap, not the fix. Pull your RUM numbers, work out whether TTFB, FCP, or LCP is failing, and only then pick from the fix list. That single reordering is the difference between spending a week on the wrong problem and fixing the right one in an afternoon.
The other thing conventional advice underplays: a huge share of “speed problems” are really app management problems. Removing dead scripts and consolidating tags is unglamorous, but it’s often the fastest win available, and it needs no developer at all. Save the Liquid rebuild for when the low-effort fixes are already banked.
Moor Marketing’s own diagnostic work with Shopify clients follows this same order for a reason. It gets to the actual cause faster, and it stops store owners paying for development time on a fix that was never going to move the metric that mattered.
— Liza
Get a Shopify speed diagnostic from Moor Marketing
Guessing which fix to prioritise is expensive when developer hours are on the line. Moor Marketing runs Shopify diagnostics and remediation as part of its broader website design and conversion rate optimisation work, backed by senior strategists who work the account directly rather than handing it off to outsourced juniors, so the fixes you pay for are the ones your RUM data actually flagged.

Before a discovery call, pull together your Shopify Web Performance report screenshots, the URLs of your three or four highest-traffic pages, and a note on which pages you suspect are slowest at checkout or on product pages. If checkout speed is part of the concern, Moor Marketing’s checkout optimisation work is worth raising in that same conversation. Book a discovery call through the Moor Marketing website and bring those details along; it’s the fastest way to turn a vague “our site feels slow” into a prioritised, costed fix list.
Sources
For further reading, start with Shopify’s own site speed analysis, the performance gaps diagnostic guide, and Liquid performance patterns documentation. For testing, use Theme Inspector for Chrome, WebPageTest, Lighthouse, and PageSpeed Insights.
- Performance gaps (Shopify developer docs)
- Improving your online store performance (Shopify Help Center)
FAQ
Is Shopify still worth it in 2026?
Yes, for most growing eCommerce brands. Shopify handles CDN delivery, image optimisation, and compression automatically, which means your speed work focuses on theme code and apps rather than infrastructure most competitors have to build themselves.
Why is my Shopify store running slow?
The three most common causes are a lazy-loaded or oversized hero image delaying LCP, third-party app scripts blocking render, and Liquid code with nested loops or repeated metafield lookups slowing TTFB. Check your Web Performance report to see which metric is actually failing before assuming the cause.
Can you make $10,000 a month on Shopify?
It’s achievable, and store speed is one of the levers that affects it directly, since faster storefronts convert visitors into buyers at a higher rate. Reaching that revenue also depends heavily on traffic volume, product margins, and conversion rate optimisation beyond speed alone.
How much does Shopify take from a $20 sale?
Shopify’s transaction fees depend on your plan and payment method, and current rates are listed on Shopify’s own pricing page rather than fixed across all merchants. Check your specific plan’s fee schedule in your Shopify admin for the exact amount on any given sale.