

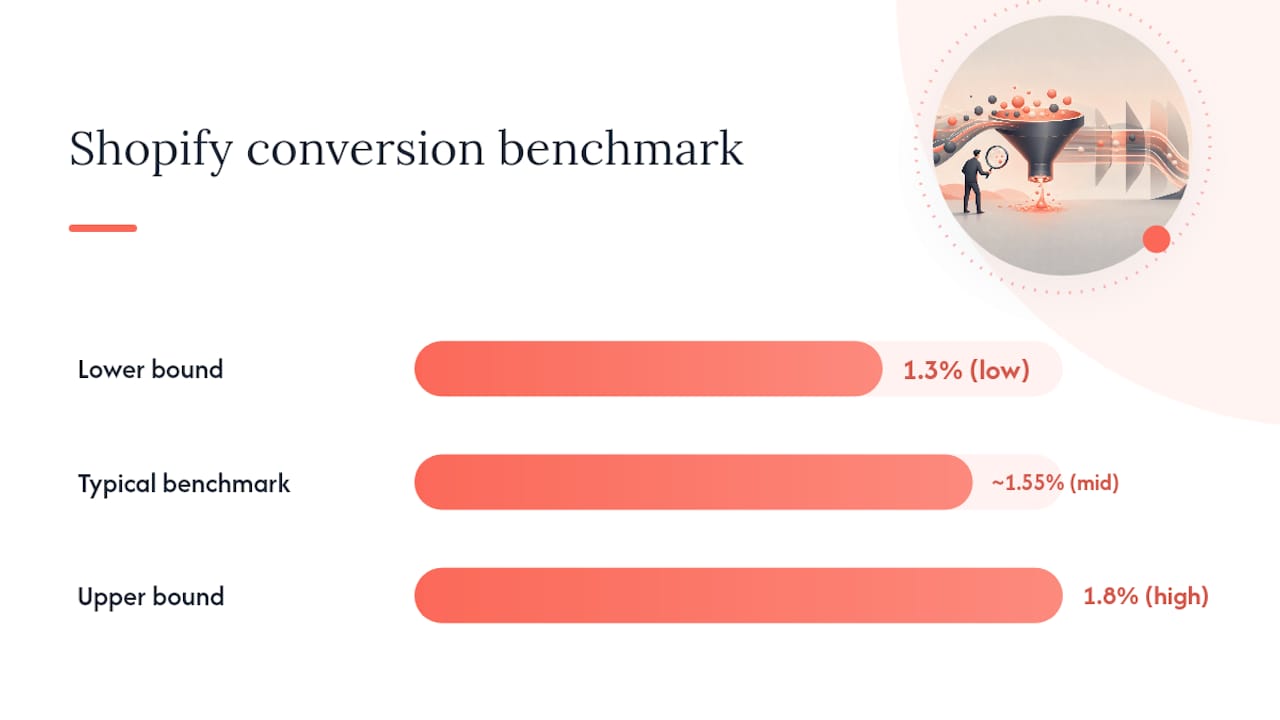
If your Shopify store converts below roughly 1% to 1.5% on genuine buying-intent traffic, treat it as low and stop guessing about why. Run a focused funnel audit today: check Shopify Analytics for where sessions drop off, test mobile page speed, and look at cart abandonment separately from checkout abandonment. Average stores sit between 1.3% and 1.8%, and the top 10% clear 4.7% or higher, so the gap tells you how much room you actually have.
TL;DR:
- Most Shopify stores with a conversion rate below 1.5% need a targeted funnel audit focused on identifying leaks at each stage of the customer journey.
- Improving mobile page speed and reducing app bloat are critical, as slow load times and layout issues are the most common performance failures.
- Fixing checkout friction by offering early shipping costs, guest checkout, and one-click payment options can significantly boost conversion rates.
- Prioritizing technical speed fixes, clear product messaging, and trust signals typically yields the fastest improvements, while testing should be systematic and impact-driven.
- A proper data-driven audit, focusing on the biggest leak first and measuring against KPIs and guardrails, can unlock meaningful revenue growth.
Table of Contents
- How to run a focused Shopify conversion rate audit
- Nine reasons your Shopify conversion rate might be low
- Fixes that typically move the needle fastest
- How to test changes without breaking what already works
- Technical checklist for diagnosing performance and UX issues
- What the data actually tells us about “fixing” conversion
- Get a Shopify conversion audit built around your actual data
- Sources
- FAQ
How to run a focused Shopify conversion rate audit
Before touching a single product page, get your maths right. Conversion rate is orders divided by unique visitors over a set period, not orders divided by pageviews. Using pageviews as the denominator inflates traffic and hides how bad the real drop-off actually is. Segment that number by traffic source and device before you draw any conclusions, because a healthy 2.8% overall figure can be hiding a mobile rate under 1%.
Once the numbers are clean, walk the funnel in order:
- Sessions to product page views — a big drop here usually points to traffic quality or landing page mismatch, not the product itself.
- Product view to add-to-cart — this is where weak imagery, unclear pricing, or a buried call-to-action does its damage.
- Add-to-cart to checkout initiated — friction here often means shipping cost shock or a forced account wall.
- Checkout initiated to purchase — payment options, form length, and trust signals live or die at this step.
Each stage points to a different class of fix, so don’t skip straight to “redesign the homepage” before you know which stage is actually bleeding.
A handful of tools cover most of this work:
- Shopify’s native analytics reports for the funnel breakdown by device and source
- Google PageSpeed Insights, checked specifically on mobile, not desktop
- Session recording tools like Microsoft Clarity to watch real visitor behaviour
- A one-question on-site survey (“What stopped you from buying today?”) for qualitative colour
The biggest leak is rarely subtle once you segment properly. If mobile add-to-cart is half your desktop rate, that’s not a rounding error, it’s your priority fix. Our audit and testing framework for Shopify stores walks through exactly this sequencing if you want a structured starting point.
Nine reasons your Shopify conversion rate might be low
Once the audit points to a stage, match what you’re seeing against the usual suspects. Most low-converting Shopify stores fall into one or more of these buckets:
- Mobile performance failures — poor Largest Contentful Paint (LCP), layout shift (CLS), and tap targets too small for thumbs to hit accurately.
- Slow page speed from app bloat — every review widget, upsell app, and tracking pixel adds load time, and Shopify stores routinely carry more scripts than they need.
- Unclear value proposition — the product page doesn’t answer “why this, why now, why you” in the first screen.
- Missing social proof near the buy button — reviews exist somewhere on the page, just not where the decision actually happens.
- Checkout friction — forced account creation, shipping costs that appear only at the final step, and a short payment method list.
- Traffic quality mismatch — a broad display campaign or an affiliate spike bringing in visitors who were never going to buy.
- Weak imagery and buried CTAs — a call-to-action pushed below the fold, or product photos that don’t show scale, texture, or use.
- Analytics artefacts — bot traffic and miscalculated denominators quietly deflating your real rate.
- No ongoing testing — pages frozen in place for months, with changes shipped based on opinion rather than data.
Pro Tip: Check traffic-source segmentation before you touch design. One paid channel or affiliate source dragging down the average is common, and pausing it can lift your headline conversion rate within days.
A store below the 1.3% to 1.8% average is a signal to dig, not a verdict in itself, since seasonality and product category shift the baseline too.
Fixes that typically move the needle fastest
Fix in this order, because technical problems compound everything downstream of them.
- Strip technical weight first. Remove unused apps, defer or delete heavy scripts, compress images to WebP, and lazy-load anything below the fold. This alone often improves mobile LCP enough to change behaviour before you’ve touched a word of copy.
- Sharpen the product page. Lead with a strong hero statement that states the outcome, not the feature. Move reviews closer to the add-to-cart button, state shipping cost and timeframe near the price, and make sure product images update when a variant is selected. Our product page playbook covers the layout details that matter most here.
- Simplify checkout. Surface shipping cost earlier in the flow rather than at the final step, enable guest checkout, and turn on Shop Pay or another one-click option. Cut form fields down to what you actually need, and place security and payment badges where hesitant buyers will see them.
- Fix the traffic mix. Pause or tighten campaigns bringing in low-intent clicks, match ad creative to the exact landing page it points to, and put more budget behind email and retargeting, where intent is already established.
- Build trust deliberately. Chase down reviews actively rather than waiting for them, add real customer photos, and make your returns policy and contact details easy to find, not buried in a footer link.
None of this needs to happen simultaneously. Our checkout optimisation process treats it as a sequence over roughly sixty days, testing one layer before moving to the next.
How to test changes without breaking what already works
Pick one primary KPI before you change anything. Conversion rate or add-to-cart rate both work, but choose one and stick with it for the test’s duration. Then set one or two guardrail metrics, typically average order value and refund or return rate, so a “win” on your primary KPI doesn’t quietly punish you elsewhere.
Rules worth following every time:
- Don’t call a test early. Run it long enough to cover a full weekly cycle, ideally two, so day-of-week traffic patterns don’t skew the result.
- Check that your sample size is large enough for the baseline conversion rate you’re working with. Low-traffic stores need longer test windows, not shorter ones.
- A result only counts as meaningful when the lift holds across the full test period, not just in a promising first few days.
For tools, Shopify’s native experiments work fine for straightforward page-level tests. Third-party A/B platforms give more control over targeting and reporting. Server-side toggles suit backend or checkout-level changes that a visual editor can’t reach.
Sequence tests by impact, not convenience:
- Test the highest-leak page identified in your audit first.
- Roll the winner sitewide before starting the next test.
- Move to the next-highest leak, repeating the cycle.
A single well-targeted test on the page bleeding the most traffic beats five scattered tweaks across five different pages. Treat every change as a hypothesis tied to a number, not a hunch you’re hoping pays off, and you’ll build a much more reliable read on what’s actually working. If you’re describing products at scale across a large catalogue, tools like AmmarAI can help keep copy consistent while you test page layout separately.
Technical checklist for diagnosing performance and UX issues
Run this checklist before assuming a conversion problem is a marketing problem.
- PageSpeed Insights / Lighthouse — track LCP, Interaction to Next Paint (INP), CLS, and the mobile score specifically, since mobile and desktop scores can diverge sharply.
- App and script audit — list every installed app and third-party script, then disable or consolidate anything not directly earning its keep. Most stores carry apps nobody remembers installing.
- Session recordings — set up Microsoft Clarity on your highest-traffic pages and watch real sessions, not just heatmap aggregates, for the first week.
- Heatmaps and on-site prompts — layer a heatmap over your product and checkout pages, and add a short exit-intent survey asking what almost stopped the purchase.
- Theme choice — a lightweight, well-coded theme with a proper CDN for images will often outperform a heavily customised older theme, even before you touch content.
Most mobile traffic problems don’t need a full redesign, they need the weight taken off the page.
What the data actually tells us about “fixing” conversion
Most advice on low Shopify conversion rates treats every store the same, and that’s the biggest mistake in this space. A furniture brand converting at 0.9% isn’t necessarily broken.
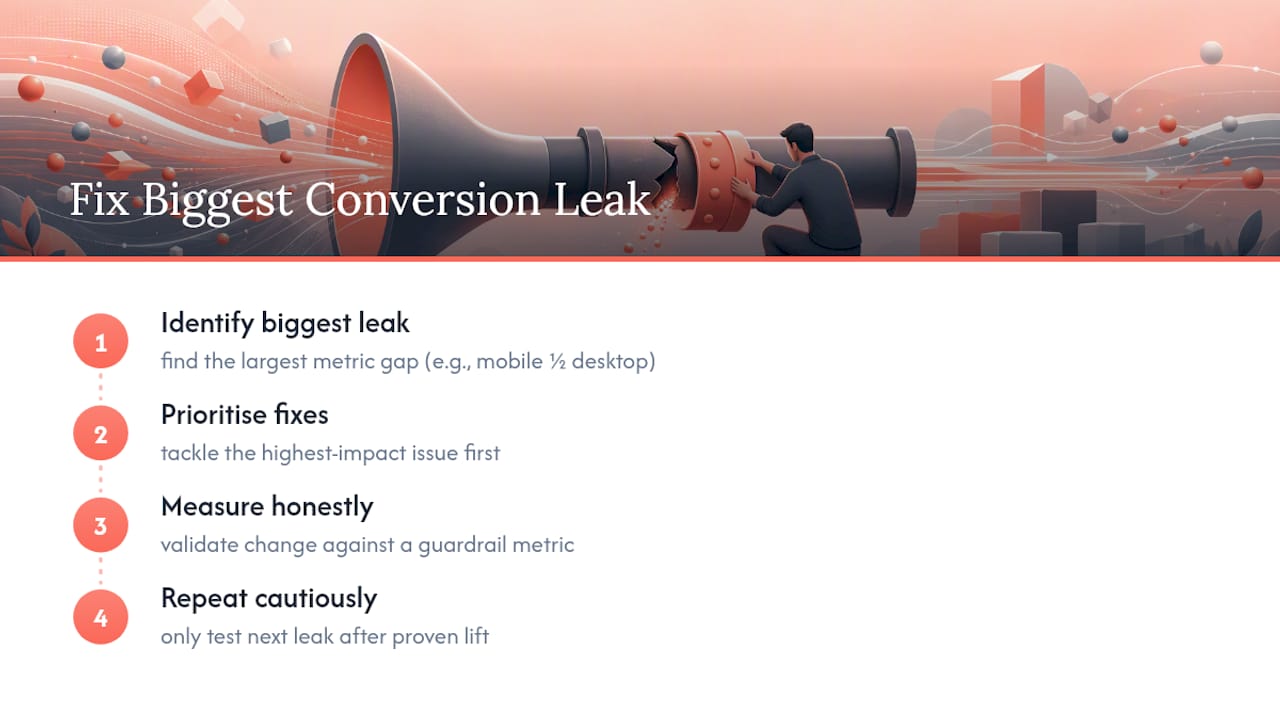
What actually separates stores that improve from stores that stay flat isn’t more testing, it’s testing in the right order. We’ve seen store owners run a dozen small tweaks over months with no clear lift, then find that one checkout field or one missing shipping disclosure was the entire story. Prioritisation beats volume every time.
The outcomes worth chasing aren’t abstract lift percentages. They’re the moment a client realises their mobile add-to-cart rate was half their desktop rate for six months and nobody had checked. Fix the biggest leak first, measure it honestly against a guardrail metric, and only then move to the next one.
— Liza
Get a Shopify conversion audit built around your actual data
Most agencies sell a generic “CRO package”. Moor Marketing runs a Shopify audit that finds your single biggest leak first, so the first weeks of work go toward the fix that will move revenue, not a checklist of theoretical improvements.
An engagement typically starts with a diagnostic covering your funnel data, mobile performance, and checkout flow, followed by a prioritised plan ranked by likely impact. From there, our team implements the fixes directly rather than handing you a report to action yourself, and every change is tied to a KPI and a guardrail so you can see what actually moved. Some clients have used this approach to unlock significant monthly sales conversion, and the same audit-first sequencing applies whether you’re troubleshooting a stalled store or scaling one that’s already working. If you’d rather have a senior strategist run the diagnosis than piece it together solo, get in touch about a Shopify audit and we’ll walk you through what a prioritised plan for your store would look like.
Sources
- How to increase ecommerce conversion rate — Shopify blog
- How to diagnose and fix a low conversion rate in Shopify – Shogun
- 17 ways to increase Shopify conversion rate (2026)
FAQ
What’s a good conversion rate for Shopify?
Average Shopify stores convert between roughly 1.3% and 1.8%, while the top 10% of stores convert at 4.7% or higher.
How can I improve my conversion rate on Shopify?
Run a funnel audit to find your biggest leak, then fix it in order: technical speed issues first, then product page clarity, then checkout friction. Test one change against a primary KPI and a guardrail metric like average order value before rolling it sitewide.
Is 2.5% a good conversion rate?
It depends heavily on your product category and average order value.
Is Shopify still worth it in 2026?
Shopify remains a solid platform for most ecommerce brands, and low conversion is almost always a store-level issue, not a platform limitation.