

That headline number, commonly cited as around 8.95% to 9.21% in recent benchmark summaries, almost never matches what your shop or GA4 reports for the same period. The gap exists because Ads Manager leans on view-through attribution, modelled conversions, and Conversions API deduplication that inflate the platform’s version of events.
Here’s what matters before you touch your budget:
- The headline figure is a platform metric, not a revenue metric. It reflects what Meta credits itself with, not what landed in your bank account.
- Reconcile before you scale. Pull your Ads Manager conversion count, your GA4 landing-page conversions, and your actual shop orders for the same seven-day window, then compare all three.
- Meta (Facebook) Ads Manager and GA4 rarely agree, and that’s expected. The size of the gap tells you more than either number alone.
If you run an eCommerce brand and haven’t checked this ratio in the last month, do it before your next scaling decision. A firm like Moormarketing typically starts every account audit here, because scaling a number that’s
inflated just scales the inflation.
Key Takeaways
Reconciling Ads Manager’s conversion rate against your shop or GA4 data before scaling budget is the single highest-leverage action any Facebook advertiser can take in 2026.
| Point | Details |
|---|---|
| Use link clicks as denominator | Calculate CVR as (conversions ÷ link clicks) × 100 for the cleanest post-click read. |
| Match benchmarks to event type | Lead-gen campaigns average 7-8% while ecommerce purchase medians sit near 1.5-2%. |
| Trust the median over the mean | Skewed CVR distributions make median benchmarks more reliable for comparison. |
| Audit measurement before scaling | Compare Ads Manager, GA4, and shop orders for the same window to catch inflation from view-through attribution and CAPI dedup errors. |
| Fix measurement before creative | Moormarketing sequences pixel and tracking fixes ahead of creative testing when auditing eCommerce ad accounts. |
Table of Contents
- What is a Facebook advertising conversion rate and how do you calculate it?
- Facebook ad conversion rates by industry: the 2026 benchmark table
- How do you correctly read Facebook ads conversion rate benchmarks?
- What counts as a good, average, or poor Facebook conversion rate?
- What factors actually drive your Facebook ad conversion rate?
- Practical ways to improve conversion rates for Facebook ads
- Why does reported CVR diverge from reality, and how do you fix it?
- A seven-step checklist to run this week
- Moormarketing’s view: what actually moves the needle for eCommerce brands
- Get Facebook ad measurement and optimisation help
- Frequently asked questions about Facebook advertising conversion rate
- Sources
What is a Facebook advertising conversion rate and how do you calculate it?
Conversion rate for Facebook ads measures the percentage of people who took a desired action after clicking your ad; a purchase, a lead form submission, an add to cart, whatever you’ve defined as the goal. The formula sounds simple, but the denominator you choose changes the number dramatically, and most marketers pick the wrong one without realising it.
You’ve got two real options for the denominator: link clicks or impressions. Link clicks is the standard choice for judging landing-page effectiveness, because it isolates what happened after someone actually engaged with your ad, rather than diluting the result with everyone who merely scrolled past it.
The standard formula:
(Conversions ÷ Link Clicks) × 100 = Conversion Rate
Two worked examples:
- Lead-form campaign: 45 leads from 620 link clicks = (45 ÷ 620) × 100 = 7.3%
- Purchase campaign: 18 purchases from 950 link clicks = (18 ÷ 950) × 100 = 1.9%
Notice the gap. A lead-gen campaign and a purchase campaign sitting side by side in the same ad account will produce wildly different conversion rates, and that’s normal, not a sign something’s broken.
Pro Tip: When reconciling Ads Manager against your own analytics, pull the equivalent landing-page session conversion rate from GA4 for the same date range and traffic source. If Ads Manager says 7% and GA4 says 4.5%, you’ve found your measurement gap, and now you know exactly how much to discount Meta’s own reporting when you’re forecasting.
Facebook ad conversion rates by industry: the 2026 benchmark table
Averages hide more than they reveal. Industry benchmarks matter more than the platform-wide headline figure, and the spread between verticals is often larger than marketers expect.
Updated benchmark breakdowns show lead generation campaigns running substantially hotter than ecommerce purchase campaigns, with lead-gen averaging somewhere around 7% to 8% while ecommerce purchase medians sit closer to 1.5% to 2%. That single distinction, lead-gen versus purchase, explains more variance in “conversion rate for Facebook ads” data than almost any other factor.
| Industry vertical | Conversion rate (CVR) | Median vs mean | Cost per conversion context | Source / sample notes |
|---|---|---|---|---|
| Education (lead-gen) | 7-9% | Mean, lead-gen datasets | Lower CPL due to high intent | Kirro 2026 benchmark set |
| Fitness & wellness | 6-9% | Mean | Moderate CPA, seasonal swings | Kirro / Influee summaries |
| Health & personal care | 5-8% | Mean | Lower CPA on impulse-driven offers | Kirro 2026 benchmark set |
| Ecommerce apparel & retail | 1.5-2.5% | Median (Triple Whale-style datasets) | Higher CPA, competitive auctions | Kirro benchmarks |
| Technology / SaaS | 1-3% | Median | Long sales cycle inflates CPA | Kirro / AdLibrary summaries |
| Travel & hospitality | 1-2.5% | Median | High CPA, price-sensitive buyers | Kirro 2026 benchmark set |
| Industrial / B2B | 0.8-2% | Median | Very high CPA, long consideration window | AdLibrary 2026 summary |
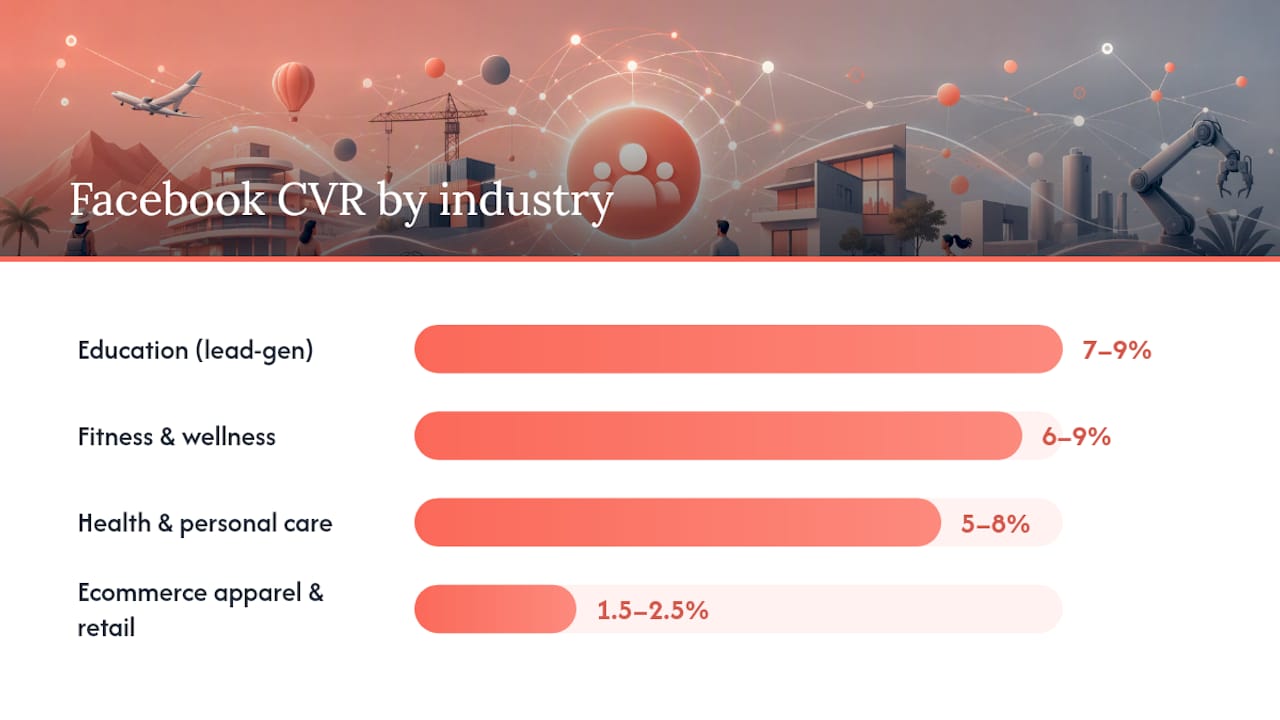
Education, fitness, and health verticals convert well on Facebook because the offer usually solves an immediate, emotionally charged problem, a course start date, a body goal, a symptom, and the decision doesn’t need months of research. Technology, travel, and industrial verticals lag because the buyer typically needs to compare options, involve other stakeholders, or wait for a trigger event like a renewal or a booking window.
A few things worth checking if your numbers sit below the range for your vertical:
- If you’re in education or fitness and under 5%, check your lead-form friction first; too many fields or a mismatched landing page kills momentum fast.
- If you’re in ecommerce and under 1%, audit your product page load speed and checkout steps before touching your ad creative.
- If you’re in B2B or industrial and under 1%, compare your funnel stage to the benchmark; a cold prospecting campaign shouldn’t be judged against a retargeting benchmark.
- If your numbers look too good to be true across any vertical, check for duplicate conversion events before celebrating.
One more nuance worth flagging: within-vertical spread can be enormous, with a 3x difference between the best and worst performers in the same industry, often driven purely by creative quality and audience temperature rather than anything structural about the category. Two apparel brands can sit in the same vertical and post 0.9% and 2.7% respectively, with the entire gap explained by better product imagery and a warmer retargeting pool.
How do you correctly read Facebook ads conversion rate benchmarks?
Averages lie in a specific, predictable way. The median, the middle value when you line up all the numbers, tends to be a far more honest benchmark for conversion rates because CVR distributions are almost always skewed by a handful of outperforming campaigns.
That’s why serious benchmark sources increasingly report both figures, and why you should treat any single “average conversion rate for Facebook ads” claim with a healthy dose of scepticism unless it specifies which one you’re looking at.
Funnel stage and conversion event change the entire conversation:
- Cold prospecting campaigns convert lower than retargeting campaigns, because the audience hasn’t built trust yet.
- Lead-gen forms convert higher than purchase events, because filling out a form asks far less of someone than handing over a credit card.
- Add-to-cart events convert higher than completed purchases, because cart abandonment sits between the two.
- High-ticket purchases convert lower than low-ticket impulse buys, almost regardless of creative quality.
The single biggest misinterpretation marketers make: comparing a lead-gen benchmark to a purchase benchmark and concluding their ecommerce store is underperforming when it’s actually sitting right on the median. Always match the conversion event and funnel stage before you judge your own number against anyone else’s.
What counts as a good, average, or poor Facebook conversion rate?
Context decides everything here, but rough thresholds still help you triage quickly.
A few practical mappings:
- A 2.5% purchase CVR puts you above the median for most ecommerce niches, worth defending rather than “fixing.”
- A 10% lead-gen CVR is a strong result for lead forms, and probably means your offer and form length are well matched.
- A 0.8% purchase CVR on a low-ticket impulse product is a red flag worth investigating immediately.
- A 1% purchase CVR on a $2,500 B2B product might be entirely acceptable, because the buyer’s decision cycle is naturally longer.
Low conversion rates aren’t automatically bad, and high ones aren’t automatically good.
What factors actually drive your Facebook ad conversion rate?
Most marketers chase the wrong lever first. Creative gets blamed for problems that live in the offer, and the offer gets blamed for problems that live in tracking. Here’s the rough order of impact, based on how these factors typically move the needle:
- Offer strength. A weak discount or unclear value proposition caps your conversion rate no matter how good the ad looks; test a genuinely better offer before touching anything else.
- Landing-page friction. Slow load times, confusing checkout flows, or mismatched messaging between ad and page routinely halve conversion rates.
- Audience temperature. Cold audiences convert lower than warm retargeting pools; blending both in one campaign muddies your read on true performance.
- Creative relevance. Ads that mirror the exact pain point or desire in your landing page headline consistently outperform generic creative.
- Attribution and setup errors. A broken pixel event or duplicate conversion count can make your CVR look better or worse than reality, independent of actual performance.
- Page speed and trust signals. Missing reviews, no visible security badges, or a page that takes more than three seconds to load bleeds conversions before anyone reads your copy.
Pro Tip: If you can only run three tests this quarter, run them in this order: fix any tracking errors first (you can’t optimise what you can’t measure accurately), test a stronger offer second, then test landing-page friction third. Creative refreshes matter, but they rank behind these three for expected impact on conversion rate.
Practical ways to improve conversion rates for Facebook ads
Optimisation works best when you tackle measurement and creative in parallel, not sequentially. Fixing your tracking without touching your offer just gives you a more accurate view of a mediocre number. Fixing your offer without clean tracking means you can’t tell whether the improvement was real or an artefact of attribution noise.
Start with the actions that move CVR directly:
- Run structured creative tests. Compare one variable at a time, hook, format, or call to action, rather than launching five completely different ads and guessing which element worked.
- Test the offer itself, not just the wrapper. A free shipping threshold, a bundle discount, or a shorter lead form often beats a prettier ad creative.
- Fix landing-page friction. Match your landing page message to your ad exactly, cut form fields to the minimum, and confirm mobile load speed under three seconds.
- Prune underperforming audiences. Kill segments that haven’t converted after a reasonable spend threshold rather than letting budget bleed across a broad audience indefinitely.
- Set sensible retargeting windows. A 7 or 14-day click window usually captures genuine intent without inflating your numbers with stale, low-value traffic.
Before any of that testing produces a trustworthy read, your account setup needs to be clean:
- Validate every Meta Pixel event in Events Manager to confirm it fires once per action, not twice.
- Implement Conversions API basics alongside the pixel for browser-loss resilience, and check for duplicate event IDs between the two.
- Standardise UTM tagging across every campaign so GA4 and Ads Manager can be compared apples to apples.
- Keep event names consistent across campaigns; a “Purchase” event named differently in two ad sets will fragment your reporting.
- Choose a sensible attribution window, ideally 7-day click, for the cleanest comparison against site analytics.
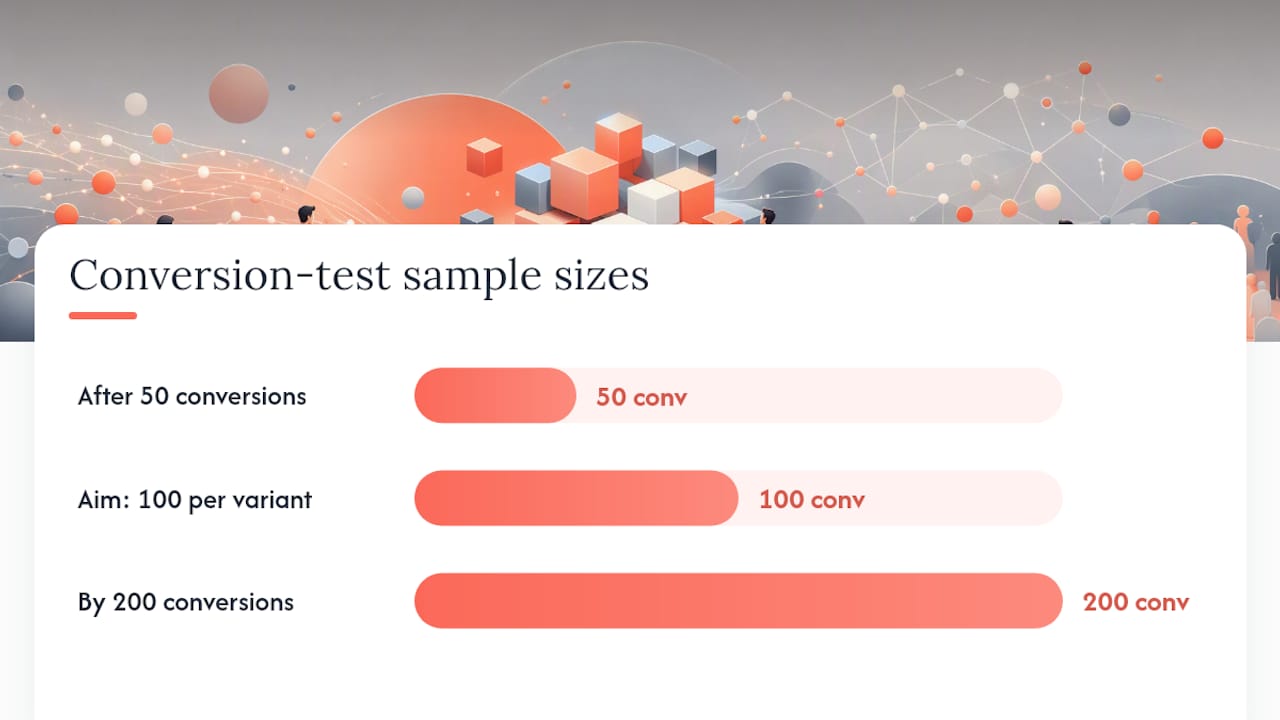
Pro Tip: Don’t call a test early. A lift that looks exciting after 50 conversions often evaporates by conversion 200. Aim for at least 100 conversions per variant before drawing a conclusion, and resist the urge to peek at results daily, since early data almost always overstates the eventual winner.
For agencies and in-house teams running structured tests, the discipline behind how testing frameworks actually validate a winning ad matters more than the number of variants you launch.
Why does reported CVR diverge from reality, and how do you fix it?
Ads Manager’s number and your bank account rarely agree, and the gap has specific, fixable causes. View-through attribution credits Facebook for conversions from people who merely saw the ad and later converted through an unrelated path. Modelled conversions estimate outcomes for users Meta can’t directly track due to privacy restrictions, adding statistical guesswork to your reported total. CAPI deduplication issues double count a conversion when both the browser pixel and the server-side Conversions API fire for the same event without a matching event ID. Session versus user counting confuses one person converting twice with two separate people converting once. Missing event IDs break the link between pixel and CAPI events entirely, inflating totals further.
Run this audit before you trust any reported number:
- Pull Ads Manager conversions for a fixed 7-day window.
- Pull GA4 landing-page conversions for the identical window and traffic source.
- Pull actual shop orders from your store backend for the same period.
- Compare all three, and calculate the ratio between Ads Manager and shop orders, that’s your “truth ratio” for measurement health.
- Check CAPI event ID injection in Events Manager to confirm deduplication is actually working.
- Set a 7-day-click-only attribution window temporarily to strip out view-through noise for a cleaner comparison.
Worth checking specifically: Meta’s Events Manager for event match quality scores, GA4’s landing page session reports, and your website’s conversion tracking setup for gaps between ad click and page load.
Methodology note: how these benchmarks were built and how to apply your own
The link-click formula, (conversions ÷ link clicks) × 100, gives the cleanest cross-account comparison because it isolates post-click performance from the noise of impression-based reach. Every benchmark in this guide uses that denominator unless stated otherwise.
Some frequently quoted figures deserve scepticism. The widely repeated 9.21% average traces back to older WordStream analyses built on methodology that predates iOS privacy changes and modern attribution modelling. Treat any single-figure benchmark as dated unless the source specifies its event definition, attribution window, and whether it’s reporting a mean or median.
Record your own benchmark the same way every time: source, date, event definition (purchase, lead, add-to-cart), attribution window (7-day click, 1-day view), and sample size. Without all five, a benchmark number is just a headline with no way to check whether it applies to you.
Meta’s own scale means platform-wide measurement changes roll out fast and can shift reported benchmarks within a single quarter, another reason to check the date on any figure you’re relying on.
A seven-step checklist to run this week
Turn all of this into action with a short, sequenced plan:
- Audit your measurement stack (days): compare Ads Manager, GA4, and shop orders for the same 7-day window.
- Fix event deduplication (days): check CAPI event IDs and pixel firing to stop double counting.
- Launch one structured creative test (1-2 weeks): isolate a single variable, hook or format, for a clean read.
- Tighten your audiences (1 week): pause segments with no conversions past a reasonable spend threshold.
- Simplify your offer (1-2 weeks): trim a lead form or test a stronger incentive against your control.
- Improve landing-page speed (days to 1 week): get mobile load time under three seconds.
- Run a retargeting sequence (2-4 weeks): build a 7 or 14-day window campaign for warm traffic, and expect the clearest CVR lift here of any single step.
Steps one and two typically clear up measurement confusion within days. Steps three through six produce a measurable shift in your true conversion rate within two to four weeks. Step seven often delivers the largest single lift, since retargeting audiences almost always out convert cold prospecting once the rest of the account is clean.
Moormarketing’s view: what actually moves the needle for eCommerce brands
The biggest revenue jumps rarely come from a cleverer ad. They come from fixing measurement first, then the offer, then the creative, in that order. Chase creative before your tracking is trustworthy and you’re optimising against noise. That sequence matters more than any single tactic in this guide.
Small interventions, a pixel fix, an audience prune, tend to show results within a week or two. Medium interventions, an offer restructure or a landing-page rebuild, usually need three to four weeks before the data is conclusive. Larger structural changes, a full funnel rebuild or a repositioning exercise, can take a full quarter to show their true ceiling.
Moormarketing has worked through this sequence with brands that scaled from modest starting revenue to seven figures a month, including a toy retailer and a global furniture brand, and the pattern holds regardless of category: clean measurement before creative, every time.
Get Facebook ad measurement and optimisation help
If you’ve read this far and realised your Ads Manager number and your shop orders don’t line up, that’s the exact problem Moormarketing solves for eCommerce brands before touching a single ad creative. Our engagements start with a measurement audit, comparing your pixel data, GA4, and shop orders, before moving into optimisation sprints covering offer testing, landing-page fixes, and audience restructuring, run by senior strategists rather than outsourced juniors.
One toy retailer we worked with scaled to $2 million in monthly sales after we rebuilt their measurement setup and restructured their offer, a result that started with the same audit checklist outlined above. If your account needs the same clarity, our Facebook social media marketing strategy engagement is the fastest way to get a senior strategist auditing your numbers and building a fix plan this month. Book a look at your account and find out whether your reported conversion rate matches what’s actually landing in your bank.
Frequently asked questions about Facebook advertising conversion rate
What is a good Facebook advertising conversion rate?
It depends entirely on your conversion event.
Why does my Ads Manager conversion rate differ from my shop’s actual orders?
Ads Manager includes view-through attribution, modelled conversions, and sometimes duplicate CAPI events that inflate the count beyond what genuinely happened. Reconciling the two numbers with a 7-day-click-only window usually closes most of the gap.
Should I use link clicks or impressions as my conversion rate denominator?
Link clicks give the clearest picture of landing-page effectiveness because they isolate people who actually engaged with your ad. Impressions include everyone who scrolled past without clicking, which dilutes the number and makes it far less actionable.
That figure originates from older WordStream data and reflects a different attribution environment than exists today. Treat it as a historical reference point rather than a current target, and check the event definition and date on any benchmark before relying on it.
How often should I check my Facebook advertising conversion rate against GA4?
Monthly, at minimum, and always before any budget scaling decision. Attribution windows and modelled conversions can shift the gap between platform and site-level numbers quickly, especially after Meta rolls out measurement changes.
Sources
- Facebook Ads Conversion Rate: Average, Formula, Tips – Shopify
- Average Facebook Ads Conversion Rate 2026 – Influee
- Conversion rate Facebook Ads: Real 2026 benchmarks – AdLibrary